The University of North Carolina at Greensboro (UNCG) is continuing to reduce its energy footprint by using all available resources for more energy efficiency on campus while supporting the University’s missions. Through the implementation of the UNC System’s first performance contract, installation of several new technologies, improvements to the steam and chilled water infrastructures, and education and outreach efforts, UNCG energy, and water consumption have decreased significantly since the baseline year FY2002-2003 designated by the State. This report provides a top-level description of the campus utility infrastructure and an update on campus progress toward utility reduction goals with projects already implemented and those planned for next year.

UNCG is currently at 96,856 EUI BTU/GSF, achieving a 23% EUI reduction from 125,963 EUI in the baseline year of 2003. Full-Time Equivalent (FTE) student enrollment has declined during and post-pandemic. The fall of 2022 showed 16,070 FTE, a 6% enrollment decline from the prior fall and a 38% increase from 12,345 FTE in the 2003 baseline year. FY2023, the campus footprint on the other hand stayed flat to the prior year, holding a 58% area increase of 2.5 million GSF of additional indoor spaces over the 2003 baseline area.

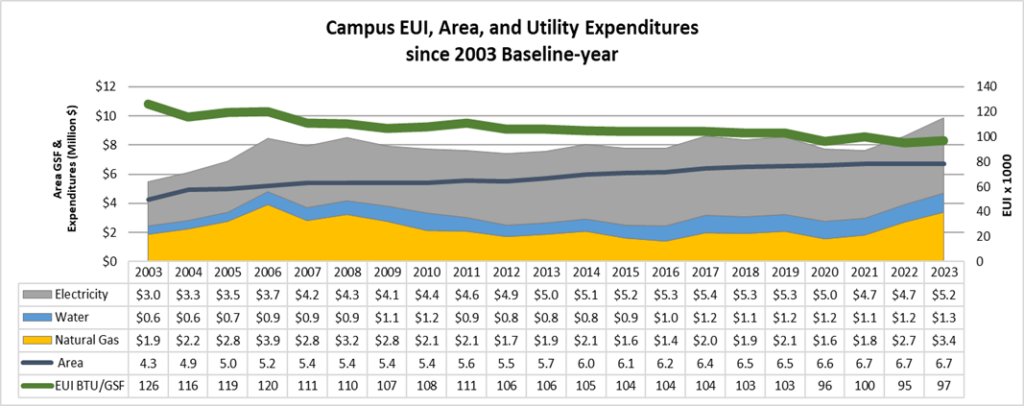
  • Energy Use Intensity EUI (BTU/GSF): UNC Greensboro currently stands at 96,856 BTU/GSF overall campus Energy Use Intensity (EUI), achieving over 23% EUI reduction from the FY2003 baseline year, and a 2% increase to the FY2022 level.

Despite the fact that UNCG has not met the 30% State-mandated EUI reduction goal from FY2015, the University dropped to 13% below the average 110,173 EUI UNC System FY2022 level after starting from 125,992 BTU/GSF/year in 2003, a lower baseline level.

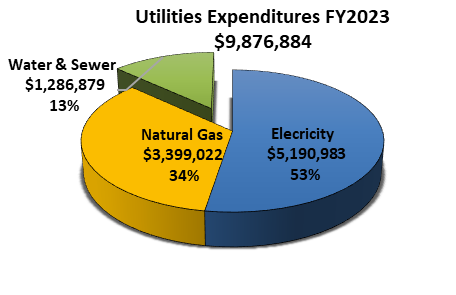
  • Utility Expenditures: The University utility expenditures were $ 9.9 million (Electricity: $ 5.2 million for 78.3 million kWh; Natural Gas: $ 3.4 million for 3.9 million therms; Water: $ 1.3 million for 123.2 million gallons of water; and only $ 2,262 dollars for 690 gal of #2 fuel oil that were used for tuning boilers at the Steam Plant). FY2023 utility costs showed a 16% higher expenditure of an extra one million dollars from the prior year.
  • Utility Key Performance Indicator (KPI): electricity, natural gas, and water total utility costs per campus area were 1.3 $/GSF, a 12% increase from $1.1 in the prior year and a 9% increase from the baseline year.  

FY2022 utility expenditures were affected by the global natural gas shortage and the cost crisis affected FY2022 and continued during the first half of FY2023. The natural gas costs increase has also affected electricity and water costs impacting the entire campus utility budget/expenditures.  The following pie chart shows the FY2023 utility expenditures breakdown, while the next graph presents the expenditures versus EUI performance and campus area since the 2003 baseline year. 

  • National Weather Service: showed Greensboro observed 3,178 Heating Degree Days (HDD), only 56 more than the 3,122 HDDs in the prior year. On the cooling side, Greensboro and the campus observed a milder summer with 1,320 Cooling Degree Days (CDD), registered 298 fewer than 1,618 CDDs in the prior year.
  • Electricity: paid $5.2 million for using  78.3 million kWh which is a 10% cost increase of almost half a million dollars for a consumption decrease of less than half percent = 230,000 fewer kWh over FY2022.
  • Natural Gas:  paid $3.4 million  for using 3.8 million therms at $0.88 per therm blended rate, an increase of 17% over $0.75 per therm of the prior year. Consumption-wise, the referenced year had 7% therms increase over the prior year’s combined natural gas and #2 fuel oil used through FY2022 winter-time curtailments.
  • Water and Sewer: paid$1.3 million for using 123,246 kGal of water, a 6% increase in potable water consumption = 6,660 additional kGal to 116,586 kGal the prior fiscal year. The campus water KPI is 18.3 Gallons/GSF showing a 77% reduction from the 2003 level, surpassing the UNCG System goal. UNCG avoided about $268,000 of total water and sewer costs by reporting 47,404 kGal of non-sewer water from campus irrigation, and evaporative cooling towers that do not go to the sewer system.  

Since the baseline level in 2003, FY2022 showed the University has expanded by a 58% in campus area with only a 21% increase in million BTU used for the operation to make it up to the 23% EUI reduction to the baseline level.

Fiscal YearAreaAll UtilitiesUtility/AreaEnergy kWh+thermEnergy/AreaEnergyEnergy Cost
 GSFCost $$ / GSFCost $$ / GSFMMBTU$ / MMBTU
20034,269,699$5,537,4611.3$4,990,9871.2537,824$9.3
20044,942,520$6,085,3481.2$5,527,6541.1571,384$9.7
20054,987,544$6,878,5191.4$6,248,6031.3594,916$10.5
20065,177,689$8,455,5031.6$7,622,4741.5620,424$12.3
20075,415,496$7,674,0701.4$6,884,4141.3602,349$11.4
20085,415,496$8,500,0931.6$7,593,9831.4597,302$12.7
20095,415,496$7,906,6631.5$6,861,6031.3577,867$11.9
20105,415,496$7,713,0991.4$6,530,2411.2585,475$11.2
20115,551,245$7,653,6061.4$6,753,1561.2615,587$11.0
20125,510,548$7,402,4851.3$6,663,9831.2582,985$11.4
20135,716,735$7,571,7261.3$6,853,7741.2605,897$11.3
20145,999,437$8,034,0921.3$7,234,7311.2629,295$11.5
20156,086,061$7,859,3901.3$6,959,8031.1635,534$11.0
20166,163,784$7,776,0211.3$6,783,4341.1642,376$10.6
20176,408,406$8,569,9001.3$7,435,1231.2668,955$11.1
20186,531,155$8,621,6911.3$7,521,7941.2674,606$11.1
20196,542,163$8,601,6911.3$7,435,3611.1672,766$11.1
20206,586,747$7,739,3591.2$6,554,6461.0634,193$10.3
20216,737,988$7,668,3081.1$6,536,5591.0673,406$9.7
20226,737,988$8,874,6611.3$7,646,9901.1641,316$11.9
20236,737,988$9,876,884$1.5$8,590,005$1.3652,616$13.2
% to FY20220%11%11%12%12%2%10%
% to FY200358%78%13%72%9%21%42%

 Energy* (Electricity + Natural Gas)Water  
Fiscal YearAreaStudentsTotal Energy CostEnergy/AreaEnergy/FTE WaterWater/AreaGallon/FTE
 GSFEq. FTEMMBTU$EUI BTU/GSFMMBTU/FTEGallonsGal / GSFGal / FTE
20034,269,69912,354537,824$4,990,987125,96344336,408,5127927,231
20044,942,52012,708571,384$5,527,654115,60645290,356,3965922,848
20054,987,54413,099594,916$6,248,603119,28045543,824,42410941,516
20065,177,68913,723620,424$7,622,474119,82745175,592,5203412,795
20075,415,49614,219602,349$6,884,414111,22742154,828,5202910,889
20085,415,49614,704597,302$7,593,983110,29541155,922,8442910,604
20095,415,49615,097577,867$6,861,603106,70638171,504,4323211,360
20105,415,49615,670585,475$6,530,241108,11137183,458,9683411,708
20115,551,24516,036615,587$6,753,156110,89238141,496,916258,824
20125,510,54816,855582,985$6,663,983105,79435122,794,672227,285
20135,716,73516,754605,897$6,853,774105,98736130,566,923237,793
20145,999,43716,195629,295$7,234,731104,89239123,906,620217,651
20156,086,06116,568635,534$6,959,803104,42438126,757,984217,651
20166,163,78417,365642,376$6,783,434104,21837133,052,004227,662
20176,408,40617,891668,955$7,435,123104,38737143,057,700227,996
20186,531,15518,153674,606$7,521,794103,29037132,712,640207,311
20196,542,16318,303672,766$7,435,361102,83537131,447,729207,182
20206,586,74718,249634,193$6,554,64696,28335130,134,944207,131
20216,737,98817,811673,406$6,536,55999,94238115,987,304176,512
20226,737,98817,025641,316$7,646,99095,17938116,586,312177,239
20236,737,98816,070652,616$8,590,00596,85641123,246,447187,669
% to 20220%-6%2%12%2%8%6%6%6%
% to 200358%30%21%72%-23%-7%-63%-77%-72%

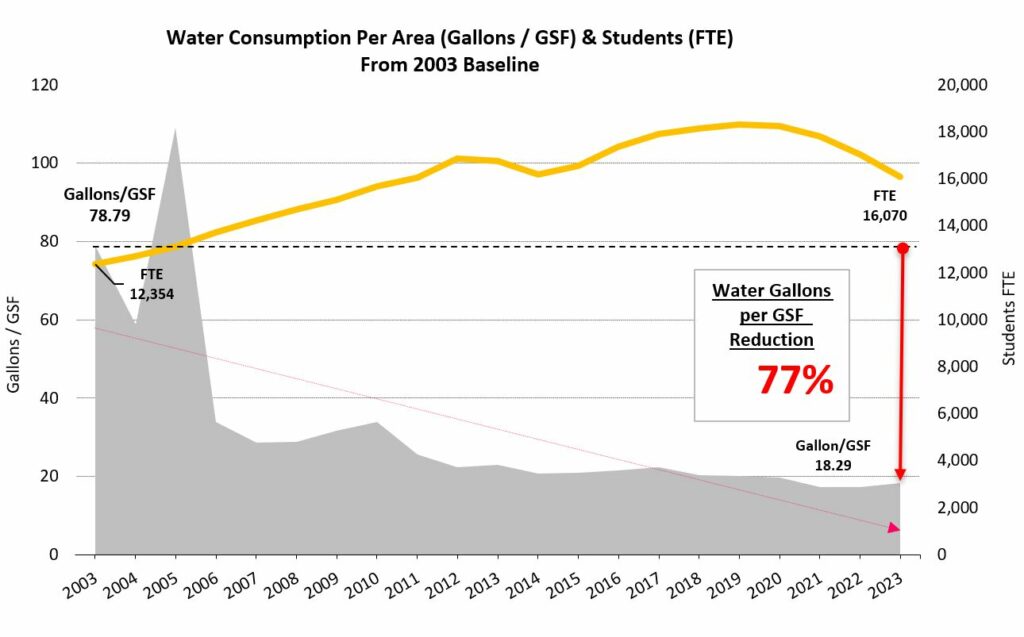
UNCG receives water and sewer service from the City of Greensboro. The University owns and maintains a distribution system that receives water through three (3) City master meters and distributes it to over 60 buildings. UNCG also has water service for several outlying properties as well. Most buildings on campus have UNCG-owned water meters that are read, and data is subsequently entered into a database. Where water is used for irrigation or cooling towers, submeters have been installed so that the University can take monthly meter readings of water that does not enter the sanitary sewer system in order to receive appropriate credits from the City of Greensboro Water Resources Department.

UNC Greensboro has made tremendous progress in reducing water consumption. UNCG’s Facilities organization places special emphasis on leak investigation and underground steam repairs, as well as on identifying and eliminating any wasteful operational practices. Installation of water-conserving fixtures during new construction and renovations has also been implemented. These practices have led to a 77% reduction in water consumption (per GSF) since the 2003 baseline year and a 6% increase when compared to the prior fiscal year 2022.

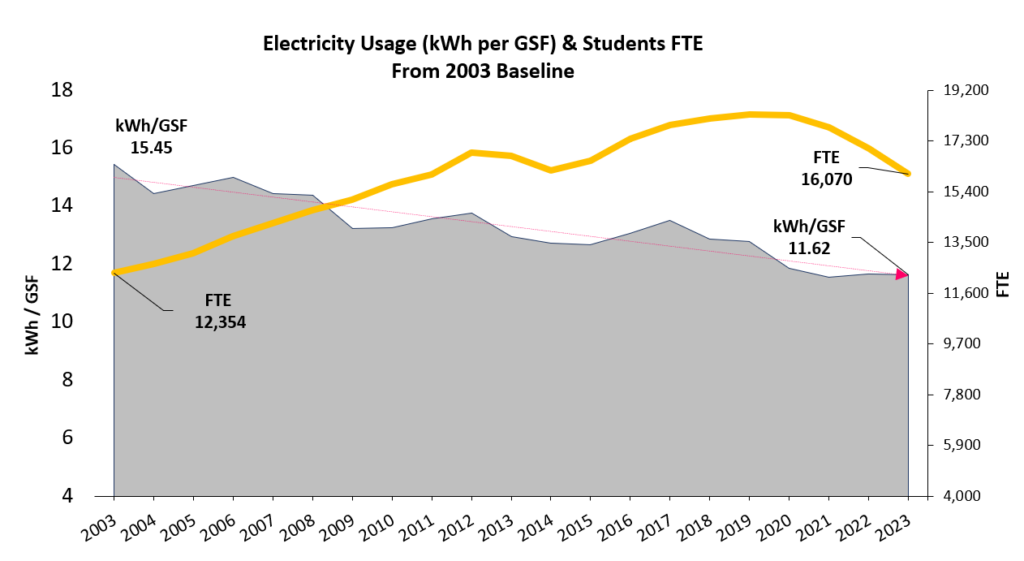
Duke Energy provides electric power to UNCG facilities through over a hundred accounts. By far the largest account is the main campus substation that feeds an underground medium voltage electrical distribution system connected to more than 60 buildings. The campus substation is on a time-of-use electricity rate schedule that is reviewed annually to evaluate the best rate options and the incentive programs for which UNCG qualifies. In addition to reviewing the main substation account, all other UNCG accounts with Duke Energy are evaluated for best rate options on an annual basis. All buildings served by the substation have electricity submeters that are read monthly, and the values are entered into a database. UNCG has taken steps toward automating the UNCG-owned meter reading process by giving the UNCG meter readers a comprehensive electronic form using an iPad with a customized Google Sheet. The new approach is more efficient because it replaces using the cumbersome Logbook where the meter readers had to write down each meter reading which was subsequently manually entered by others into a spreadsheet.

In FY2023, the University’s total electricity bill was $5.2 million for 78.31 million kWhs, reflecting 11.62 kWh per GSF in electricity KPI, and 4,873 kWhs per FTE student. FY2023 showed less than half a percent decrease to 11.66 kWh/GSF in FY2022 and a 25% reduction to 15.45 kWh/GSF baseline year KPI.

From December 1, 2015, UNCG purchased natural gas for the Steam Plant through State Term Contract 405N, which is currently held by Texican Natural Gas Company, LLC. As mentioned earlier in this report, starting June 1, 2023, UNCG Steam Plant natural gas like all other accounts on the campus and outlying properties is directly served by different Piedmont Natural Gas (PNG) direct tariffs.  Complying with N.C. Gen. Stat. § 105-164.13(52) which provides tax exemption to State agency accounts, all University natural gas accounts are tax-free.

In FY2023, the Steam Plant’s total natural gas expenditures were $2.95 million purchasing 3.5 million therms. Therms consumption-wise, this is a 29% increase over the baseline year and a 7% increase of approximately 243,000 additional therms to FY2022. However, the prior fiscal year had purchased about 89,000 of #2 fuel oil through natural gas curtailments in the prior winter that had not happened in the current winter. With that being said, the total therms from combining natural gas and fuel oil would result in 3% therms increase = 120,000 therms in FY2023 over the prior year. Natural Gas consumption increase over the prior year was mainly due to higher makeup water used in the Steam Plant due to some leaks that the University is working on as resources are available.  

FY2023 Natural gas’s KPI (BTU/GSF) recorded 57,202, showing a 3% increase over the last year and a 22% decrease to 73,253 BTU/GSF in FY2003. Natural gas energy per student is 24 MMBTU/FTE, which shows a 9% increase compared to FY2022 and a 5% decrease from the baseline KPI.

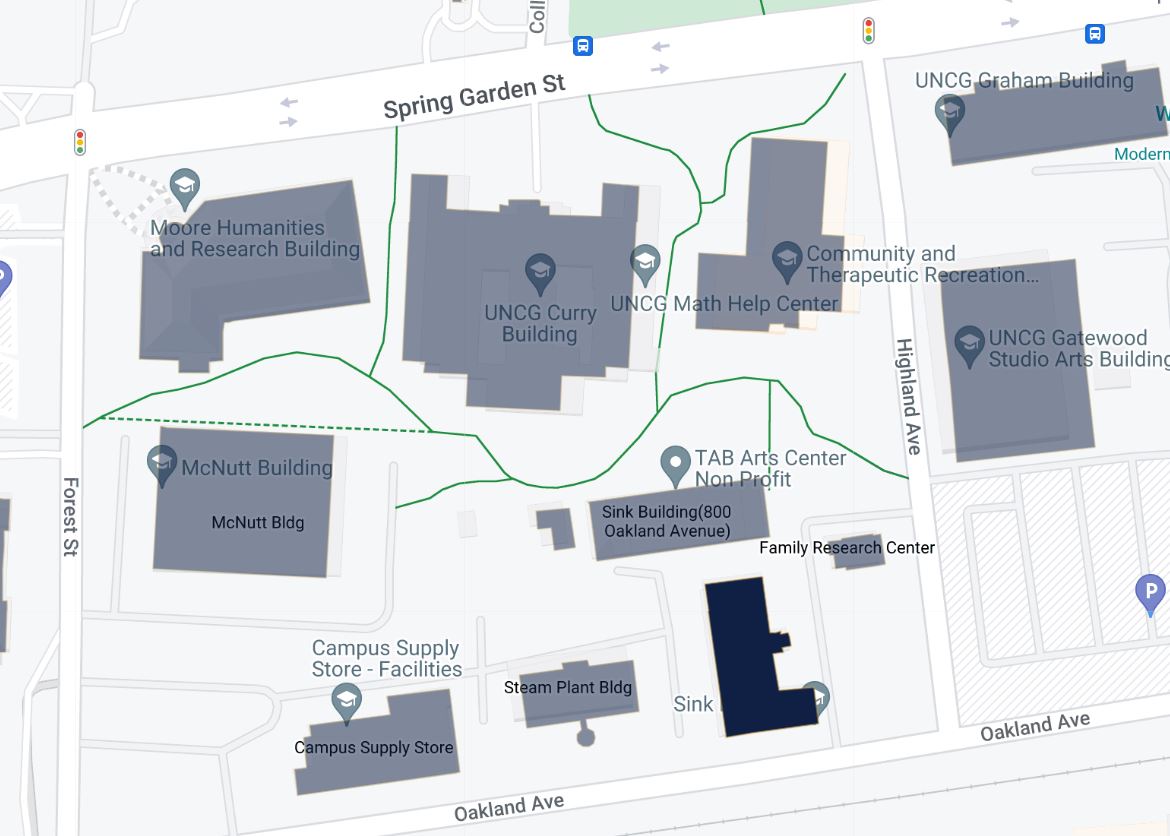
The UNCG Steam Plant is capable of using No. 2 fuel oil as a backup fuel to natural gas. This provides the University with an emergency fuel source and allows Piedmont Natural Gas (PNG) to interrupt natural gas service to the campus during times of peak gas demand. In FY2023, UNCG did not have any curtailment that required using fuel oil as a backup for natural gas. Only a few gallons of fuel oil were used to tune the boilers as part of the Steam Plant’s annual preventive maintenance.  

The University uses purchased power and natural gas to create chilled water and steam that are distributed to the campus. Most buildings connected to the Steam Plant and Chiller Plants do not have a steam meter or chilled water meter; however, the University has developed a comprehensive Campus Metering Plan to install steam meters and chilled water meters in all buildings. Facilities Operations uses an assigned building’s gross square footage to allocate the total steam and chilled water cost for each entity.

Steam: to 63 buildings on the main campus, the Steam Plant sends steam through underground pipes that return back in a condensed form. The UNCG Steam Plant has four boilers with 190,000 pounds per hour (PPH) total capacity. Steam distribution capacity covers the campus steam peak load including the recently constructed Nursing and Instructional Building (NIB) that came online in December, 2020.

UNCG used HB 1292 Utility Savings Carry Forward funds to maintain and improve the Steam Plant’s performance. In FY2020, new boiler controls were installed to replace outdated ones with a new burner management system and master controller. In FY2022, Boiler #4 Economizer was replaced with a new one, and Boiler #1 feedwater pump was downsized, and added a new variable frequency drive VFD to optimize performance. Boiler #3 Economizer was replaced in 2023. And Boiler #2 Economizer is planned for FY2024. 

Much of the campus steam infrastructure and piping system is 50 years old. The system has been periodically serviced in response to failures or normal wear and tear. Using renovation and repair funds, the University replaced three different sections over the years so far. Phase-4 section of manholes #73 to #74 EUC to Bryan Building Service Drive at Theta Street was designed to replace steam and condensate pipes, manhole refurbishment, and site work and planned for two phases due to budget constraints. Phase-A between the Elliott University Center and Sterling St completed in Summer 2019. In the summer of 2023, Phase-B construction work is in progress, between Sterling St. and the Bryan Building. The current Campus Master Plan updated recently by Affiliated Engineers and Sasaki, UNCG has included five (5) high-priority steam projects with a $3.9 million estimated cost to replace and renew critical portions of the steam distribution system.

UNCG Steam Plant serves over 3.9 million GSF including the NIB building. In FY2023 the Steam Plant produced over 277 million pounds of steam. The steam produced reflects a 1% increase of over 3 million more pounds for 56 HDDs in additional wintery weather over FY2022. Steam makeup water was 7.3 million gallons, a 55% increase = 2.6 million additional gallons of water used in 2022. The steam production energy and water consumption and costs can be further controlled if UNCG has the funds to move forward with replacing the critical portions of the steam and condensate distribution system.

Chilled Water: UNCG McIver Chiller Plant (4 chillers 6,000-ton total capacity) and South Chiller Plant (2 chillers 3,000-ton current capacity) produce chilled water to serve HVAC needs in 43 buildings including the recently constructed NIB facility. The two chiller plants both serve over 2.8 million GSF including NIB and Ragsdale Mendenhall Residence Hall which were recently (2019-2020) connected to the campus chilled water loop.

A new project is under design to complete the campus chilled water loop which would result in a more efficient and reliable chilled water distribution infrastructure. The project is also planned to abandon the dedicated chiller plants of four buildings on campus after being served by the campus loop.